![]()
Deadline-Driven Panic Has Passed — the Structural Supply Shortage Behind It Has Not, showed Q1 2026 A1 Solar Index
A deadline passes. A supply constraint does not.”
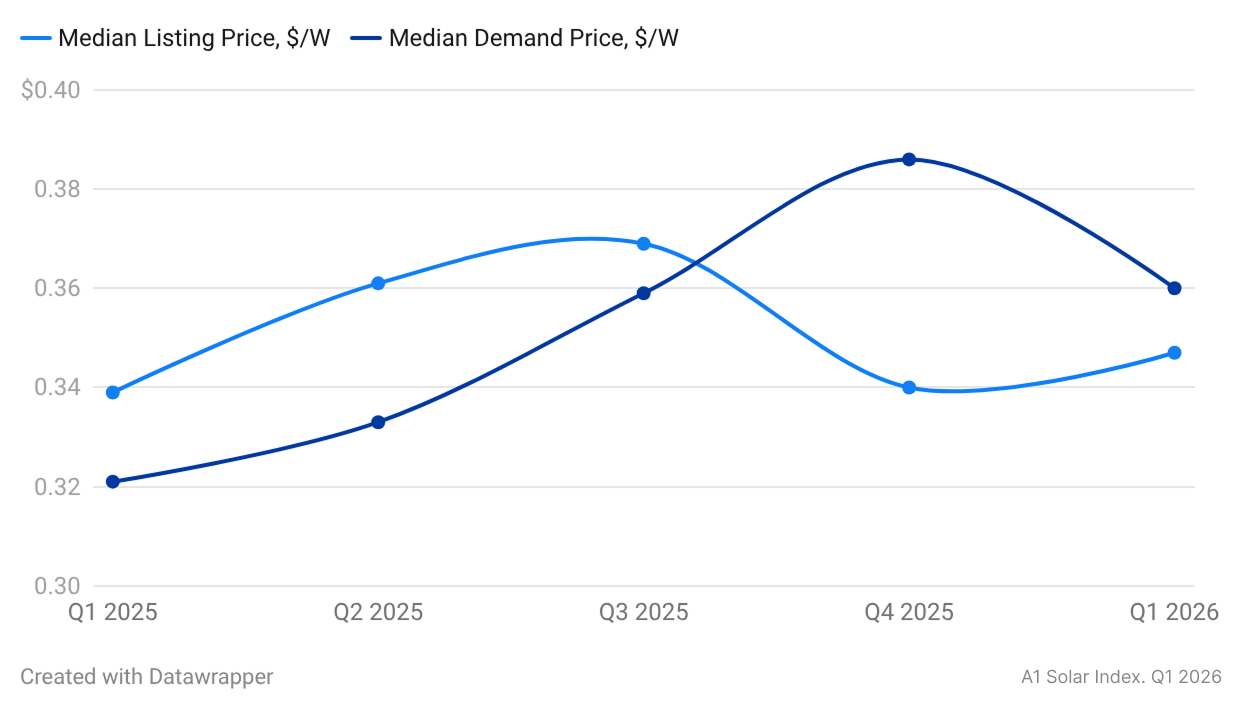
CORAL SPRINGS, FL, UNITED STATES, June 24, 2026 /EINPresswire.com/ — U.S. solar buyers paid 3.55 percent above median listing prices in Q1 2026 — down from 13.42 percent a quarter earlier, but still above asking across six of eight active markets, according to the Q1 2026 A1 Solar Index. Median listing prices rose a modest 2.1 percent quarter-over-quarter to $0.347 per watt.
The compression reflects normalization, not softening. Q4 2025 was driven by two simultaneous shocks: import duties that closed major low-cost supply routes, and the December 31 expiration of the federal residential solar tax credit that pushed buyers to rush procurement. Both deadlines passed — but the supply constraint they exposed did not.
Six of eight active U.S. regions still paid above median listing prices in Q1 2026 — and in several markets, by a wide margin. West South Central buyers paid 98 percent above the local median, South Atlantic 63 percent above, Mountain 52 percent above. Buyers are not overpaying out of panic — they are overpaying because tariff-compliant, specification-grade inventory is not available at listed prices.
Additional findings from the Q1 2026 A1 Solar Index:
The composite index closed at 83, up five points from Q4 2025, as inventory doubled quarter-over-quarter — though levels remain at just 42 percent of the Q1 2025 peak, leaving the market with far less buffer than historical norms
Two regions — New England and Pacific — paid below the median listing price, confirming that buyer leverage still exists where local supply is more competitive
All three key raw material inputs — silver, aluminum, and non-Chinese polysilicon — are rising heading into peak installation season, pointing to further price pressure in Q2 2026
The Q1 2026 A1 Solar Index tracks three dimensions of market health — price stability (40%), inventory levels (30%), and demand change (30%) — sourced from real buyer transactions, not surveys or forecasts. Brand performance across 87 manufacturers, regional maps, and state incentive breakdowns are all covered in the full Q1 2026 report.
—
A1 SolarStore is one of the leading U.S. suppliers of solar panels and energy equipment, serving customers from individual homeowners to commercial contractors. The A1 Solar Index is a proprietary quarterly indicator built exclusively on real marketplace transaction data.
Egor Uchvatov
A1 SolarStore
press@a1solarstore.com
Visit us on social media:
LinkedIn
Instagram
Facebook
YouTube
Legal Disclaimer:
EIN Presswire provides this news content “as is” without warranty of any kind. We do not accept any responsibility or liability
for the accuracy, content, images, videos, licenses, completeness, legality, or reliability of the information contained in this
article. If you have any complaints or copyright issues related to this article, kindly contact the author above.
![]()
Media gallery